A Data-Driven Evaluation of Pay in Dietetics
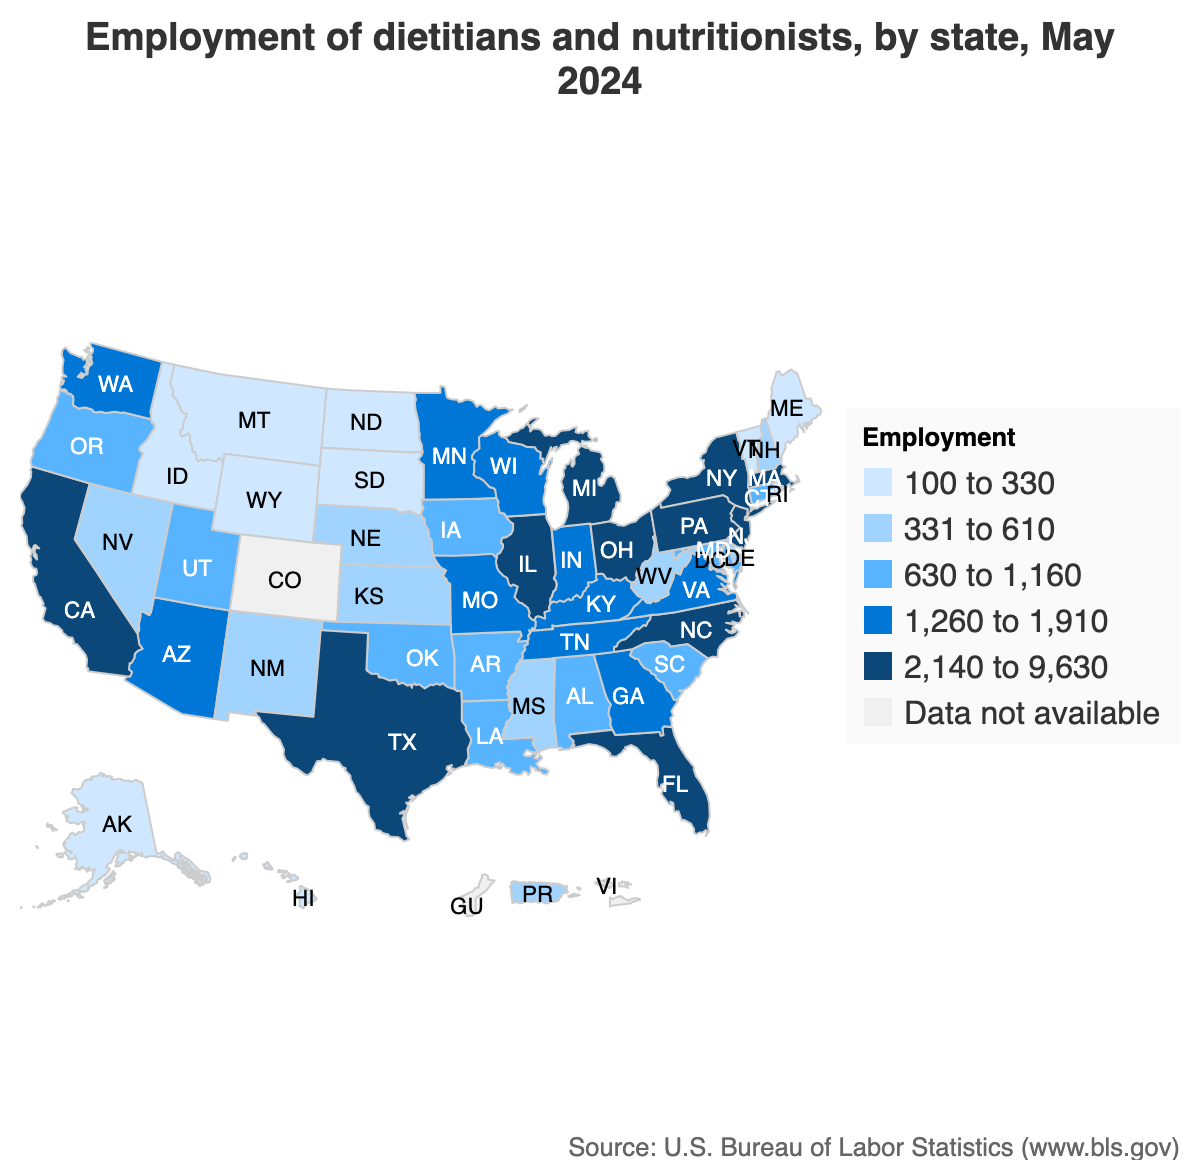
BLS wage data on dietitian and nutritionists, 2024

Wallstreet

Telehealth Worker
Over the past 15-20 years, discussions around pay in dietetics have often focused on the profession's relatively low starting salaries. Although wages have increased over the last two decades, many still question whether the growing educational requirements are matched by an appropriate level of compensation.
While there is some basic data out there providing general insights into pay trends, detailed and granular analyses of dietetics wages are still quite limited. Compensation should be an important part of any profession's draw, and dietetics is no different. This analysis presents the results of several exercises diving deep into national level salary data to gather more details on how salaries in dietetics fare.
Generally speaking, evaluating compensation isn't as straightforward as it sounds because it often depends on the context presented. Are we talking about whether dietitian pay is competitive with similar healthcare fields? or perhaps the highest-paying industries in the U.S.? Additionally, equally important is the evaluation of how compensation has changed once adjusted for inflation. Has real wage growth kept up, stagnated, or even declined? And of course, what are some ways to improve the compensation? Will extra education provide that boost many are seeking? These are all relevant and important questions to be answered.
To explore the state of compensation within dietetics, this analysis addresses 4 main questions:
- How has compensation in dietetics changed over the last 20 years?
- How does dietitian pay compare to other health and non-health professions?
- What is the estimated wage premium (if any) for earning a Master's degree in dietetics?
- How do lifetime earnings differ between bachelor's- and master's-educated dietitians?
The first two questions help us understand how compensation in dietetics has evolved over time. The last two questions focus more directly on whether pursuing a Master's degree in dietetics offers a tangible financial benefit.
How has compensation in dietetics changed over the last 20 years?
The Academy of Nutrition and Dietetics (AND) conducts its own compensation survey, which is generally well done.
But beyond a snapshot analysis, understanding how wages have actually changed over time provides additional useful context. For example, are wages at least keeping pace with the cost of living? Have efforts over the years to improve compensation made any significant impact? And within the healthcare space, how do dietitians compare with peers within and outside of healthcare?
For this part of the exercise, this analysis leverages national salary and compensation data from the Bureau of Labor Statistics (BLS). Despite some criticisms, the BLS remains one of the best and most reliable sources of high-quality wage data.
Occupation Overview
Outlined below are the occupations we are interested in comparing. In table form, we list out each occupation's Standard Occupational Classification (SOC) codes, titles, and a brief description of each.
| SOC | Title | Brief Description |
|---|---|---|
| 29-1031 | Dietitians & Nutritionists | Plan and conduct food-service or nutrition programs, counsel individuals or groups, and may supervise food-service departments. |
| 29-1141 | Registered Nurses | Assess patient health problems and needs, develop and implement nursing care plans, and maintain medical records. |
| 29-1051 | Pharmacists | Dispense drugs prescribed by physicians and other health practitioners. |
| 29-1071 | Physician Assistants | Provide healthcare services typically performed by a physician, under the supervision of a physician. Conduct complete physicals, provide treatment, and counsel patients. May, in some cases, prescribe medication. Must graduate from an accredited educational program for physician assistants. |
| 29-1122 - 1129 | Therapists | Includes physical, occupational, speech-language, respiratory, and exercise physiologists. |
| 39-9031 | Fitness & Recreation Workers | Provides instructions for exercise programs and recreational activities. |
| 15-1252 - 1253 | Software Developers | Design, implement, test, and maintain software systems and applications. |
| 25-2021 - 2023 | Teachers (K-12) | Professional primary and secondary educators who plan lessons and instruct students. |
A Note About the Data in the BLS
While the BLS provides high-quality wage data in the U.S., it of course will have certain limitations. The data come from a sample of employer self-reports, meaning they capture reported wages rather than total compensation like bonuses, benefits, or stock options.
The category for dietitians also includes nutritionists, meaning the wages assumed to represent dietitians may also include income from non-licensed nutritionists. As a result, the BLS estimates maybe be slightly lower than those from the Academy of Nutrition and Dietetics, which surveys only RDNs.
Lastly, BLS data doesn't have key demographic details such as age, race, and ethnicity — factors that the Academy's reports include.
Nominal Median Wages (2004 - 2024)
Our first chart shows nominal wages over the past 20 years. Nominal wages simply refer to the amount paid (basically what's reported on the paycheck). Naturally, we expect these wages to rise over time as salaries adjust to the ever growing market. This is exactly what we observe in the chart below. Based on this chart, we see that the median wage for dietitians & nutritionists was $73,850 in 2024, compared 10 years ago in 2014 where it was $56,950.
Real Median Wages (2004 - 2024)
However, assessing nominal wages alone is not entirely helpful because it does not account for the rising costs of living due to inflation. To consider inflation, examining an adjusted real wage is necessary in order to evaluate how the profession's compensation compares against inflation and how its purchasing power has shifted over time.
To factor in inflation for our plot, we used the Consumer Price Index (CPI). The CPI is a measure that tracks the average change in prices for a fixed basket of goods and services over time. By dividing the nominal wage by the relative change in CPI, we can then calculate the inflation-adjusted real median wage, which reflects purchasing power in constant dollars:
\( \text{Real Median Wage}_{t} = \text{Nominal Median Wage}_{t} \times \frac{\text{CPI}_{\text{base year}}}{\text{CPI}_{t}} \)
The base year here is the point in time we use as a reference to adjust all other wages. In this case, we've chosen the year 2024 because it's the most recent year available, and it gives us the clearest sense of how past wages translate into a very recent year's dollar value.
Now that we've plotted the inflation-adjusted real median wages, the salary trends look less impressive. Unlike the steady growth seen in the nominal wage chart, the chart for real wages show a much flatter trend over 20 years for almost every profession pictured. It appears the only professions which experienced real wage growth >$10k over 20 years are physician assistants and software developers. In fact, some professions (e.g. pharmacists and teachers) have actually had their wages decline relative to the rising costs of living since the Covid-19 pandemic. For pharmacy in particular, this pattern is especially concerning: while compensation has been declining in real terms, the cost of pharmacy education has continued to rise. Perhaps related to this decline - pharmacy school applications have dropped sharply, with some estimates showing more than a 60% decline between 2011 and 2021.
How does dietitian pay compare to other health and non-health professions?
Over the past 20 years, it appears that inflation-adjusted wages for dietitians and nutritionists have remained relatively stable. A similar pattern is seen among other allied health professions, though pharmacists have experienced actual declines in real wages. Nurses and therapists do show some overall wage growth, and also continue to earn a noticeable wage premium over dietitians, as reflected by higher baseline pay levels. The trend for physician assistants and software developers also do show some more real wage growth but there is a noticeable dip and a slight recovery after Covid. And lastly, teachers also appear to be experiencing a real-wage decline, similar to the pharmacists but not as drastic.
What is the estimated wage premium (if any) for earning a Master's degree in dietetics?
As of January 2024, the Commission on Dietetic Registration (CDR) now requires a master's degree to become an RDN. The value of this additional requirement has been debated for more than a decade now, especially in regards to its return on investment.
According to the Academy's 2021 Compensation Survey, the estimated wage premium for holding a master's degree was only $0.78 per hour higher than that of a bachelor's degree holder.
Converting this into an annual figure:
$$\$0.78 \times 40 \times 52 \approx \$1,622$$
That's roughly $1,622 more per year for a full-time (40 hours/week, 52 weeks/year) position and before even factoring in the additional tuition costs of the master's degree.
If this premium for Master's degree holders reported in the AND's survey is accurate, this should justifiably raise questions about the added value of the degree requirement and the return on investment. Although graduate degrees may yield long-term professional advantages, the short-term financial return reflected in the survey data provides limited evidence in support of this requirement.
With that said, it is also unclear whether this $0.78 per hour value is adjusted for factors like experience or location (among many other confounders). About 52% of respondents held a master's, 4% a doctorate, and the remaining 44% a bachelor's. Without accounting for differences in years of experience (e.g., if most master's-level dietitians were early in their careers while bachelor's-level dietitians had 5-8 more years of experience), the comparison also isn't as meaningful. A major experience or demographic gap probably isn't likely in this survey between degree holders, but it's still worth a closer look before drawing firm conclusions.
Integrated Public Use Microdata Series-USA (IPUMS-USA)
To dig a bit deeper for this analysis, we will now turn to the IPUMS-USA dataset. The IPUMS-USA offers harmonized microdata from the U.S. Census and the American Community Survey (ACS). These are high quality data and allows for long-term comparisons of social and economic characteristics of the US population across multiple decades. The ACS is conducted annually by the U.S. Census Bureau and is one of the largest continuous household surveys in the world. And with it, we can get some pretty detailed demographic, occupational, educational, and income-related information for any surveyed individuals or households.
Limitations wise - the data from ACS are self-reported, which means they will always be subject to some potential reporting bias. However, the survey's large sample size and design make the dataset quite desirable for use.
Inclusion Criteria
Before working with the ACS data, we have to apply several inclusion criteria to match our population characteristics to how the BLS defines "employed dietitians and nutritionists."
Specifically, the inclusion criteria for the analysis will be:
- Currently employed individuals
- Wage and salary workers, excluding self-employed and unpaid family workers
- Those not employed in the Armed Forces
- Those outside of agriculture and farming
- Individuals who reside in one of the four major U.S. regions: the Northeast, Midwest, South, or West.
- Prime working-age adults between 22 and 70 years old
- Respondents with valid and positive income values
- Those with at least a bachelor's education
These filters narrow the ACS microdata to a subset that more accurately reflects the civilian, noninstitutionalized workforce captured in BLS occupational wage statistics. This approach makes the wage and demographic comparisons for dietitians and nutritionists as methodologically aligned with official labor estimates as possible.
A bit of Caution
After applying the inclusion filters on the ACS data so that it matches the BLS, the 2023 ACS sample for dietitians and nutritionists shows a median wage of about $60,000 and a mean of roughly a little over $61,000. For comparison, the 2023 BLS data report a median of $69,680 and a mean of $71,280.
Despite efforts to match population characteristics as closely as possible, the ACS-based sample remains approximately $10,000 lower on salary scale than the BLS figures. This discrepancy likely reflects potential differences in sampling and the fact that BLS wages are reported by employers, while ACS relies on self-reported income from individuals.
Therefore, the next part of this exercise should be suggestive rather than conclusive, as there simply isn't enough of a good sample of dietitians and nutritionists in the ACS to guarantee certainty in the estimates. It is based off a final population-sample of 767 dietitians and nutritionists surveyed in the ACS in the year 2023, and is also relatively theoretical in its conduct.
With our earlier inclusion criteria applied, the next logical step is to decide which variables belong in our wage model. To be frank, the building of a meaningful statistical model requires a fair bit of background knowledge. Any measured variable can be modelled statistically, but whether a variable should be included for analyses highly depends on the context and relevant domain knowledge.
To meaningfully compare wages between those with a master's and a bachelor's degree, here's a few variables we selected to be adjusted for our analysis:
- Age: Older individuals generally have more work experience and education (presumably), in turn, higher earning potential.
- Race, Ethnicity, and Sex: Wage disparities across these demographic lines are well documented and should be adjusted for.
- Industry Sector, Hours Worked, Region of residence (including D.C. and PR), and Metropolitan Area: Certain industries, working hours, residential regions and metros typically command varying levels of pay and are associated with differences in education obtainment.
Based on these factors, we can construct a simple weighted regression model to adjust for key differences between groups and estimate, in dollar terms, the potential salary premium associated with a master's degree. It is worth emphasizing that the choice of confounders to include in the model is always open to debate, and there are likely unmeasured factors not accounted for here that could further lead to unaccounted bias.
$$ \begin{align*} \widehat{\mathbb{E}}\!\left[\text{Wage 2023}_{i}\right] &= \hat{\beta}_{0} + \hat{\beta}_{1}\text{Education}_{i} + \hat{\beta}_{2}\text{Race}_{i} + \hat{\beta}_{3}\text{Ethnicity}_{i} \\ &\quad + \hat{\beta}_{4}\text{Sex}_{i} + \hat{\beta}_{5}\text{Age}_{i} + \hat{\beta}_{6}\text{Region of Residence}_{i} \\ &\quad + \hat{\beta}_{7}\text{Work in Metro}_{i} + \hat{\beta}_{8}\text{Industry}_{i} + \hat{\beta}_{9}\text{Hours Worked}_{i} \end{align*} $$
Estimates are derived from a survey-weighted generalized linear model (svyglm), incorporating person-level survey weights to account for stratification and clustering.
Survey-Weighted Regression Output
Interpretation
Again, this model above estimates the relationship between annual wage-based income and various demographic and occupational factors among dietitians and nutritionists based on the 2023 ACS microdata. The coefficients in the table above represent on-average the expected change in annual wage in 2023 for dietitians and nutritionists associated with each variable, while holding all other covariates constant.
Quick Summary
- It appears there is indeed a Master's degree premium
Dietitian and nutritionists with a master's degree earn approximately $3,780 more per year than those with only a bachelor's degree, on average, after adjusting for all other confounding covariates in our model. This premium is notably higher than the $1,622 difference reported in the AND's 2021 Compensation Survey. Again, this difference is likely due to methodological differences: while the ACS relies on self-reported income across all occupations, the AND focuses more narrowly on credentialed RDNs and the BLS estimates are drawn from employer-reported compensation. - There are additional variations in wages based on differences in demographics, work hours, and work locations
Black dietitians and nutritionists earn about $9,731 less on average annually than White peers, while other races earn roughly $1,424 less. Hispanic/Latino dietitians and nutritionists earn $2,088 less than non-Hispanic peers while male dietitians earn about $3,265 more than female dietitians and nutritionists. Age and work hours also matter: each additional year of age is associated with a $490 increase in annual wages, and each additional hour worked per week corresponds to about $1,584 more annually. Industry patterns matter as well: compared with the Healthcare and Social Assistance sector, those working in Education earn $1,215 less annually, those in Food Service earn roughly $4,400 more annually, and those in All Other Industries earn about $597 more annually. Geographic differences are evident when comparing U.S. regions: using the Northeast as the reference group, dietitians in the Midwest earn about $1,984 less annually, those in the South earn roughly $937 less, and those in the West earn $12,006 more. Lastly, workplace metropolitan status appear to have a smaller impact: dietitians in non-metropolitan areas earn approximately $1,663 less than those in metropolitan areas.
Because the sample size is relatively small (as noted earlier), many of our estimates unfortunately have large standard errors, which limits the confidence we can place in any conclusions.
How do lifetime earnings differ between bachelor's and master's educated dietitians?
In the last exercise, we found that the single-year cross sectional master's vs. bachelor's degree wage difference in 2023 is about an annual premium of roughly $3,780 for master's degree holders.
However, the single time-point approach does not capture how the wage premium associated with a master's degree accumulates over time. In other words, assessing the value of a master's degree can also be conducted via a measurement of lifetime earnings rather than the annual snapshot our model provided earlier.
To do this, we have some additional considerations:
- Individuals with a master's degree typically spend two extra years in school, during which they generally do not earn a full-time wage.
- The cost of those additional two years of graduate education should also be factored in.
- Meanwhile, bachelor's degree holders begin working sooner, earning income during those same two years.
Assuming retirement at age 65, we can use our weighted regression model to estimate reasonable starting salaries for dietitians with a bachelor's and a master's degree, which then serve as the basis for projecting their lifetime earnings under typical assumptions.
Predicting Starting Wages from our Weighted Regression Model
Using the weighted regression model we created earlier, we can predict and simulate the starting wages of two hypothetical dietitians:
1. Let's start with what's likely the most representative profile of a dietitian in the U.S.:
- White, non-Hispanic, Female
- Works Full-Time (40 hours per week)
- Lives in a Metropolitan Area
- Employed in the Healthcare Industry
- Assumed to be living in the Northeastern Regions
These characteristics can be translated into the model's variable values as follows:
$$\text{Race} = 0 \; (\text{White}), \quad \text{Ethnicity} = 0 \; (\text{Non-Hispanic}), \quad \text{Sex} = 0 \; (\text{Female}), \quad \text{Region} = 0 \; (\text{Northeast})$$
$$\text{Hours Worked} = 40, \quad \text{Metro} = 0 \; (\text{Lives in Metro Area}), \quad \text{Industry} = 0 \; (\text{Healthcare})$$
2. Specify the age and educational paths:
A. Represents a typical bachelor's-level entry-level dietitian
$$\text{Education} = 0 \; (\text{Bachelor's Degree})$$
$$\text{Age} = 23$$
B. Represents a typical master's-level entry-level dietitian
$$\text{Education} = 1 \; (\text{Master's Degree})$$
$$\text{Age} = 25$$
3. Predict 2023 Entry-level Wages (good sensitivity check)
These numbers represent the model-predicted 2023 entry-level salary of a typical 23-year-old dietitian with a bachelor's degree education, and the expected entry-level salary of a 25-year-old dietitian with a master's degree education (assuming starting dietetic internship and master's program right after bachelor's graduation), estimated from our ACS-based weighted regression model earlier.
We can verify whether the predicted master's wage premium of $3,780 holds by adjusting the bachelor's-educated dietitian's age upward by two years, bringing her to age 25. This aligns both individuals in age and effectively removes the unaccounted-for age advantage present in the original comparison for the master's candidate.
The difference between the master's-level salary of $57,217 and the age-adjusted bachelor's salary of $53,437 is approximately $3,780. This is good news because our model estimates the education premium for holding a master's degree at $3779.61, meaning we passed our sensitivity check.
Yearly Wage and Cumulative Projections
With our two predicted starting salaries established, we can now move into an even more theoretical exercise: projecting lifetime earnings while accounting for typical annual raises, inflation, and the cost of obtaining a master's degree. The goal here is to estimate (under these simplified and highly theoretical assumptions) whether a master's degree produces a long-term earnings premium for dietitians, and if so, how large that premium might be over an entire working career when compared to a dietitian with only a bachelor's degree.
Again, the two scenarios we assumed earlier were:
- A dietitian with a bachelor's degree starting work at age 23 in 2023 (with a starting wage of $52,457) and working until age 65
- A dietitian with a master's degree starting work at age 25 in 2023 (with a starting wage of $57,217) and working until age 65
The table below shows the wage, cumulative wage, and difference between cumulative wages of the two dietitian pathways by age. It assumes a typical 3.5% annual raise, and 2% inflation (very theoretical in recent years). The 2-year median master's tuition cost of $57,780 is also subtracted from the master's degree holder's earnings table. The cost of the median master's degree used in our analysis is found here.
Wage Projection Table
Summary at Age 65
Plot of Cumulative Wages of a Bachelor's educated Dietitian v. Master's educated Dietitian, by age
Conclusion
So, is a master's degree worth it?
Hopefully, this data-driven exercise has provided newer ideas about the ways to examine salary dynamics within dietetics. That said, the ongoing conversation around low compensation in the field remains crucial. Increasing baseline pay closer to levels seen in professions such as nursing is an important step, but meaningful change will likely require a broader shift in how employers value the profession.
Whether pursuing a master's degree is 'worth it' ultimately depends on individual circumstances. Based on the analyses above using ACS data and assuming typical real wage growth conditions, a master's graduate would accumulate roughly just $15,177 more in real lifetime earnings compared to a bachelor's graduate due to joining the workforce two years later and subtracting additional educational costs. Deciding if this trade-off is worthwhile depends on personal goals, ambitions, and the additional opportunities a master's degree may provide, which are not captured in this analysis.
It should also be noted that the comparison between the hypothetical master's and bachelor's educated individuals assumes baseline career paths: both remain consistently employed but do not pursue extraordinary opportunities such as promotions, negotiating higher salaries, or taking on roles outside the typical work environment.
Beyond the Master's Degree
A graduate degree, however, may open doors to career advancement, facilitate promotions to higher-level roles, and confer greater professional prestige over time. These are all factors which can positively influence compensation and cannot be properly accounted for in our model. Additionally, introducing a graduate degree requirement, which entails significant upfront costs, could reduce the future supply of dietitians. A smaller supply may increase demand and theoretically lead to rising wages, though this effect is not well documented and remains academic. Improving equity and access to the profession will remain a lofty goal if the cost of improving compensation is the reduction in the supply of employable dietitians.
References
Bureau of Labor Statistics. Occupational Employment and Wage Estimates. https://www.bls.gov/oes/current/oes_nat.htm (Accessed October 1, 2025)
Dosedel, Erik. Compensation and Benefits Survey 2021. J Acad Nutr Diet. 2021;121(11):2314-2331. https://www.jandonline.org/article/S2212-2672(21)01258-2/fulltext
Steven Ruggles, Sarah Flood, Matthew Sobek, Daniel Backman, Grace Cooper, Julia A. Rivera Drew, Stephanie Richards, Renae Rodgers, Jonathan Schroeder, and Kari C.W. Williams. IPUMS USA: Version 16.0 [dataset]. Minneapolis, MN: IPUMS, 2025. https://doi.org/10.18128/D010.V16.0